Loading collection...
📊
Technical Analysis Vocabulary
Chart patterns, indicators, and price action concepts
12 words
All 12 Words

support level
/səˈpɔːrt ˌlɛvəl/a price point where buying interest is strong enough to prevent further decline
“The stock bounced repeatedly off the $50 support level before finally breaking through.”
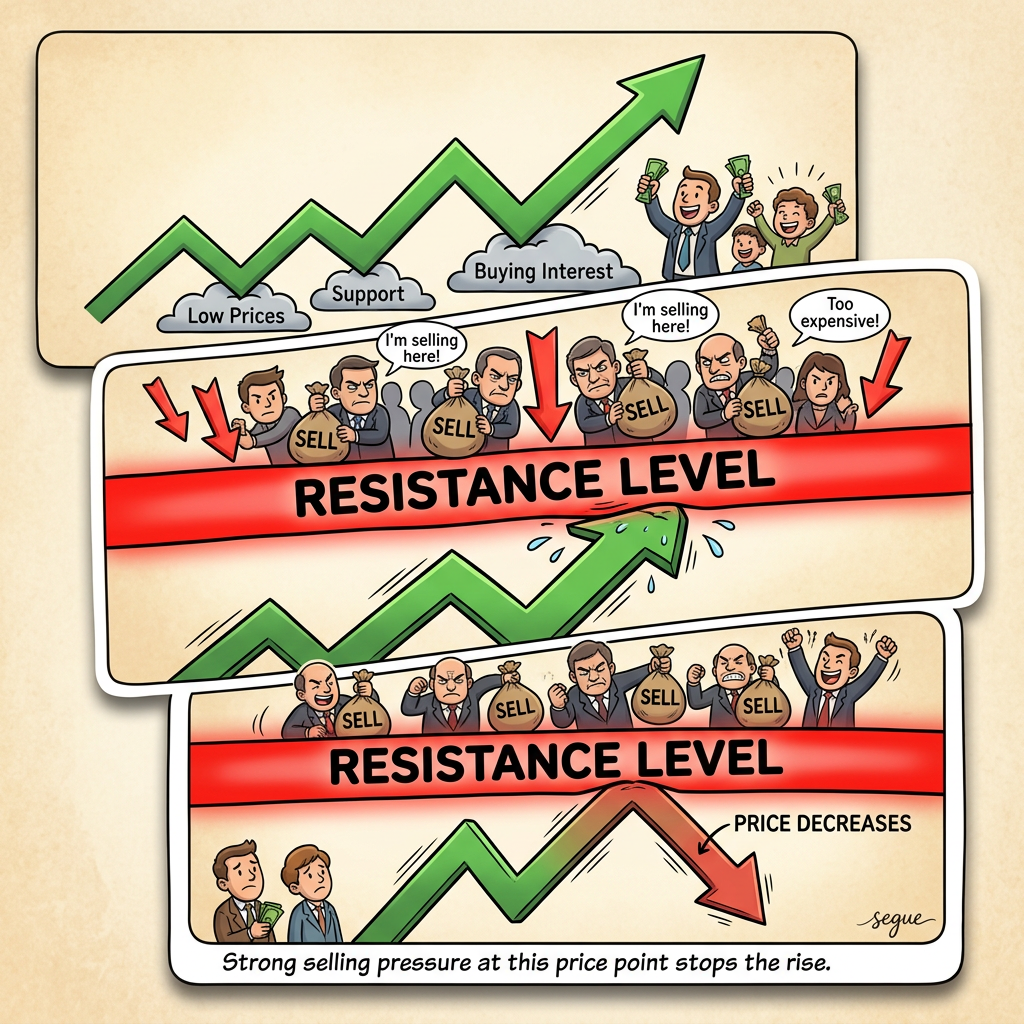
resistance level
/rɪˈzɪstəns ˌlɛvəl/a price point where selling pressure is strong enough to prevent further advance
“The stock failed to break above the resistance level at its 52-week high.”
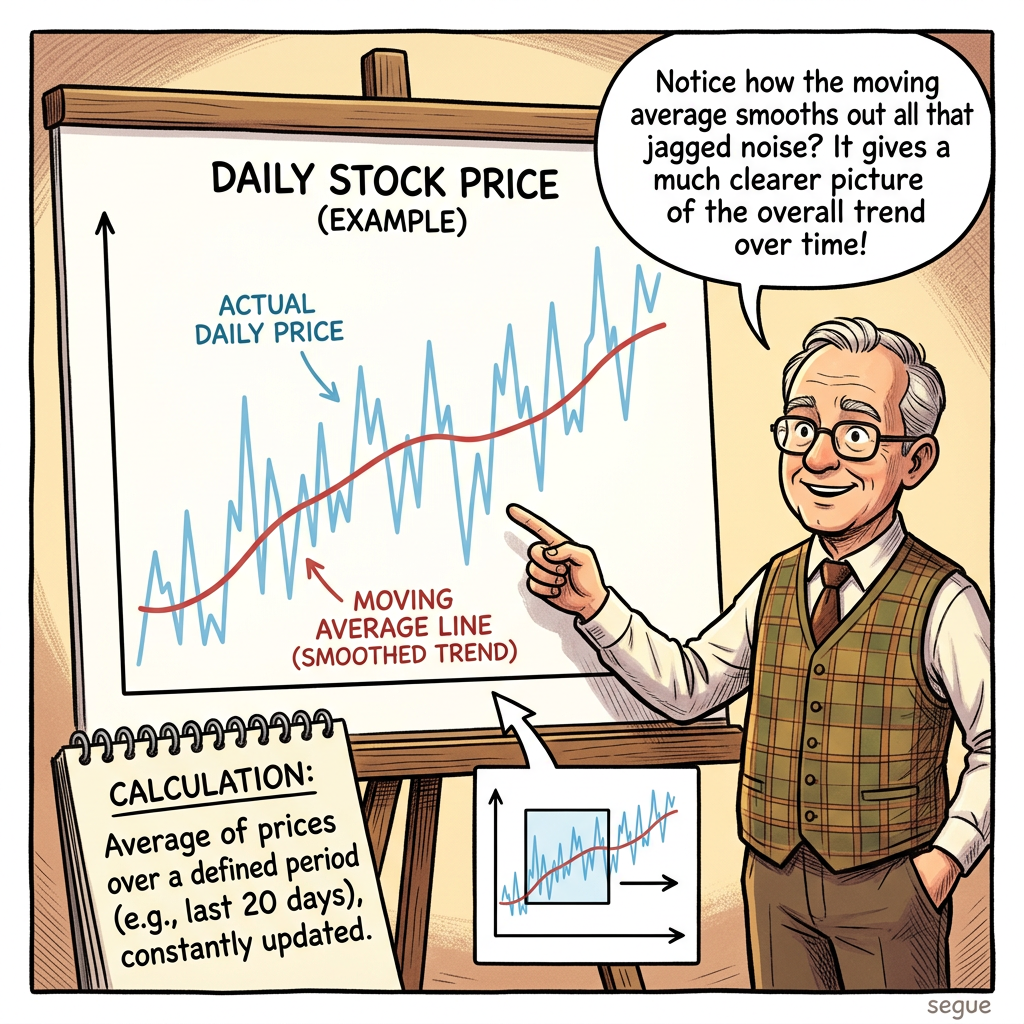
moving average
/ˈmuːvɪŋ ˈævərɪdʒ/a calculation that smooths price data by creating a constantly updated average price over a defined period
“When the 50-day moving average crossed below the 200-day, traders interpreted it as a bearish signal.”

candlestick
/ˈkændəlˌstɪk/a chart element showing the open, close, high, and low prices for a period, resembling a candle
“The long-wick candlestick suggested sellers drove the price down before buyers regained control.”
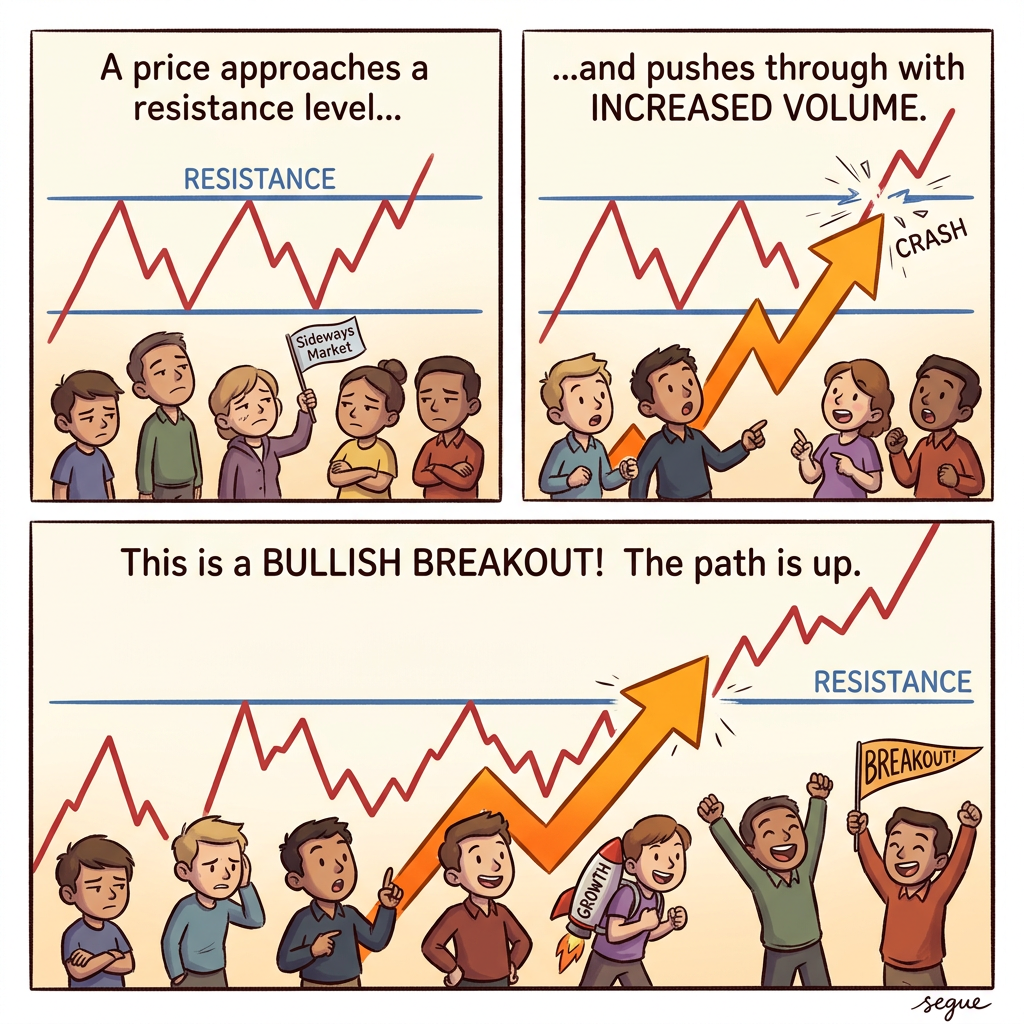
breakout
/ˈbreɪkaʊt/when a price moves above a resistance level or below a support level with increased volume
“The breakout above $200 on heavy volume confirmed the bullish trend continuation.”
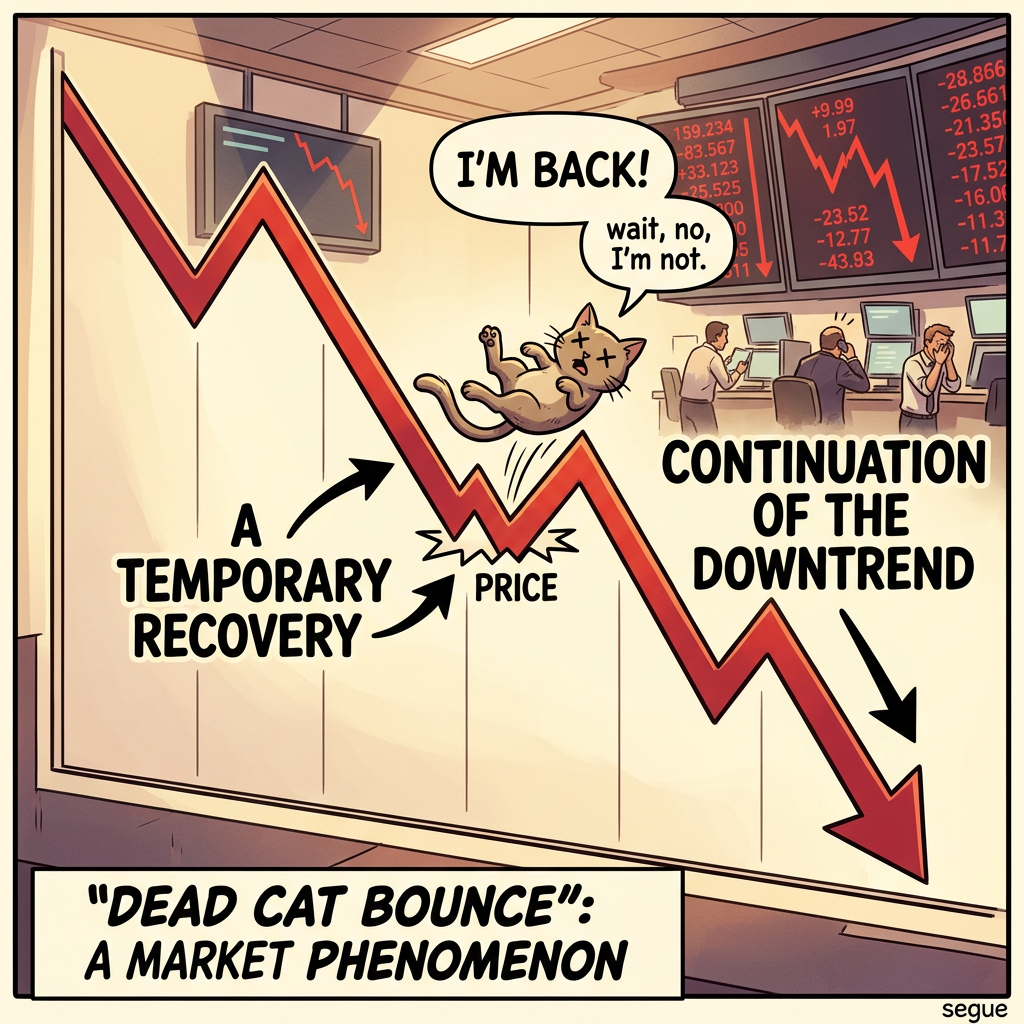
dead cat bounce
/dɛd kæt baʊns/a temporary recovery in a declining asset's price, followed by a continuation of the downtrend
“Investors who mistook the dead cat bounce for a reversal suffered further losses.”

head and shoulders
/hɛd ənd ˈʃoʊldərz/a chart pattern with three peaks — a higher middle peak flanked by two lower ones — signaling a trend reversal
“The head and shoulders pattern formed over six months, warning of the major decline ahead.”
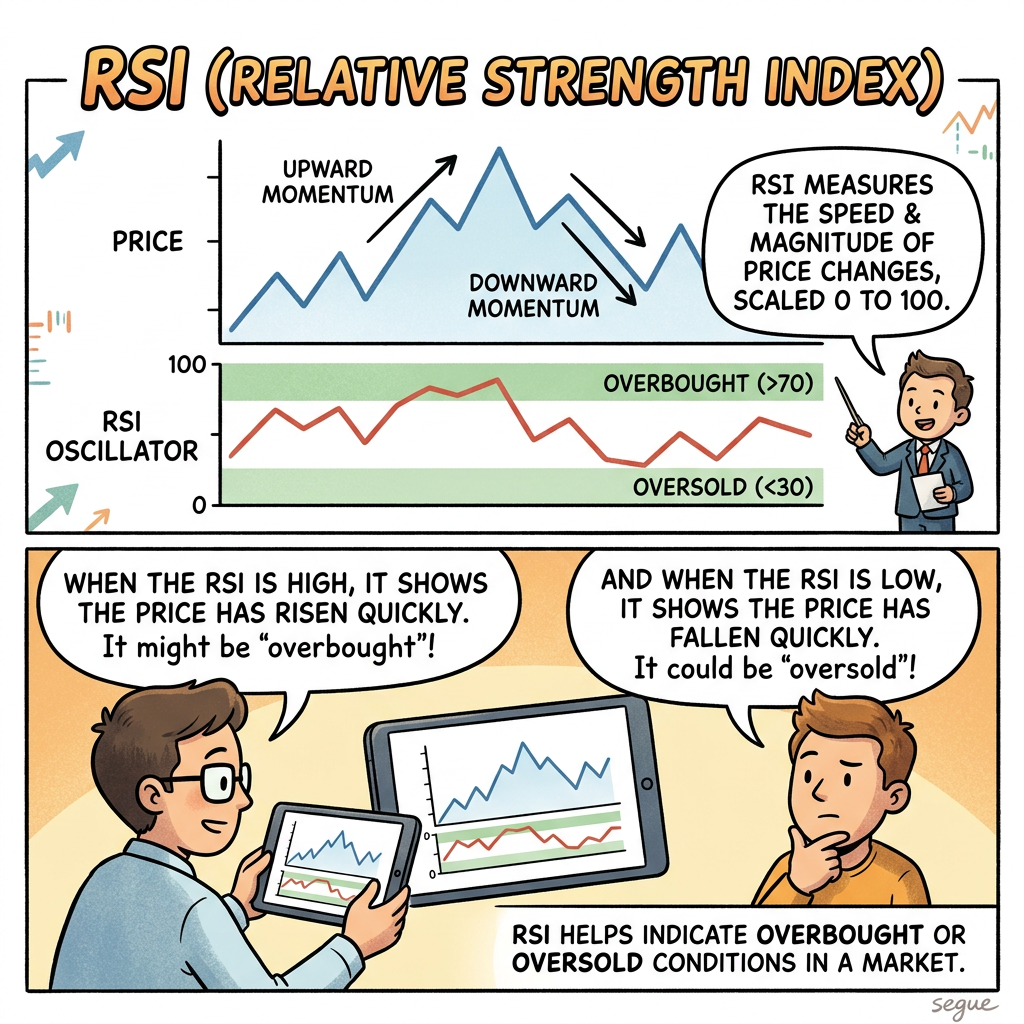
RSI
/ˌɑːr ɛs ˈaɪ/relative strength index — a momentum oscillator measuring the speed and magnitude of recent price changes, scaled 0 to 100
“An RSI above 70 indicated the stock was overbought and potentially due for a pullback.”

MACD
/ˈmækdiː/moving average convergence divergence — a trend-following momentum indicator showing the relationship between two moving averages
“The MACD crossover signal triggered the algorithm to enter a long position.”
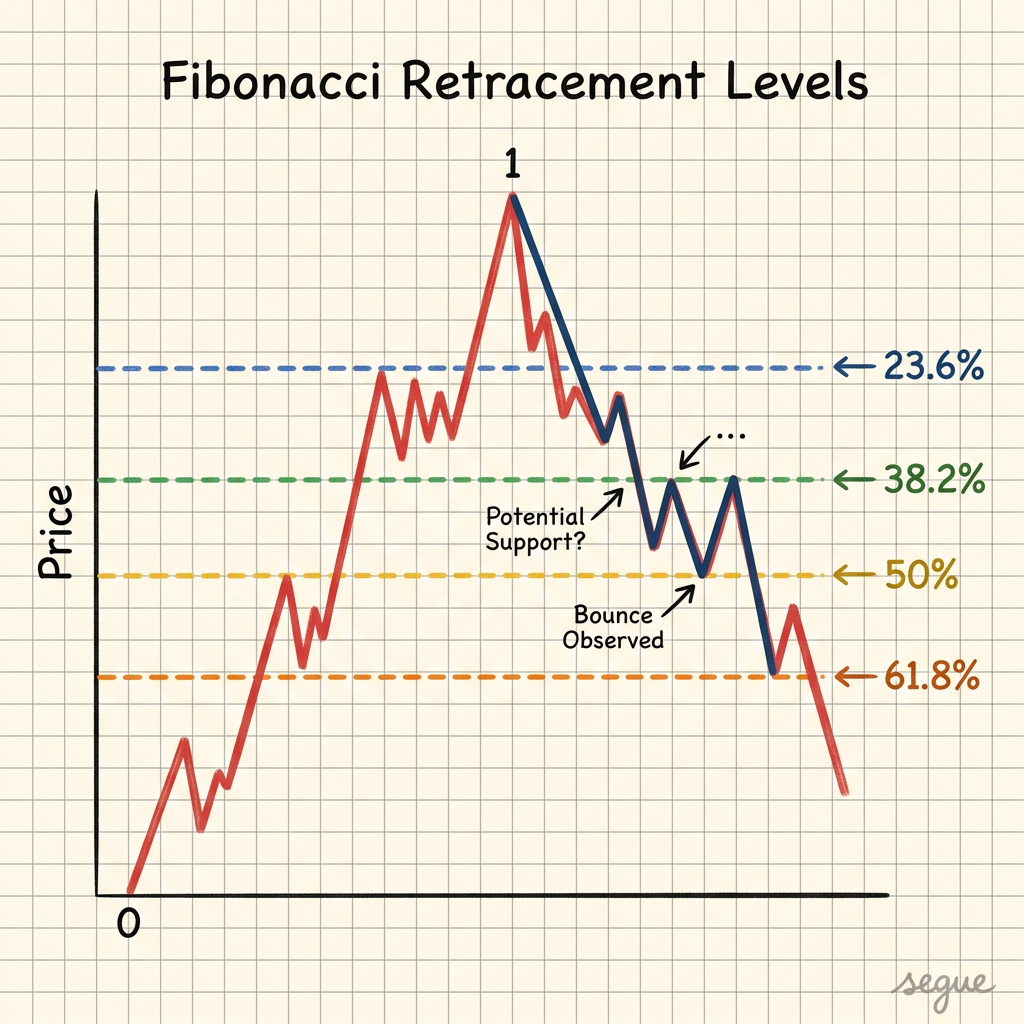
Fibonacci retracement
/fɪˈbɒnətʃi rɪˈtreɪsmənt/horizontal lines on a chart at key Fibonacci ratios indicating where support or resistance may occur
“The stock retraced to the 61.8% Fibonacci level before resuming its uptrend.”
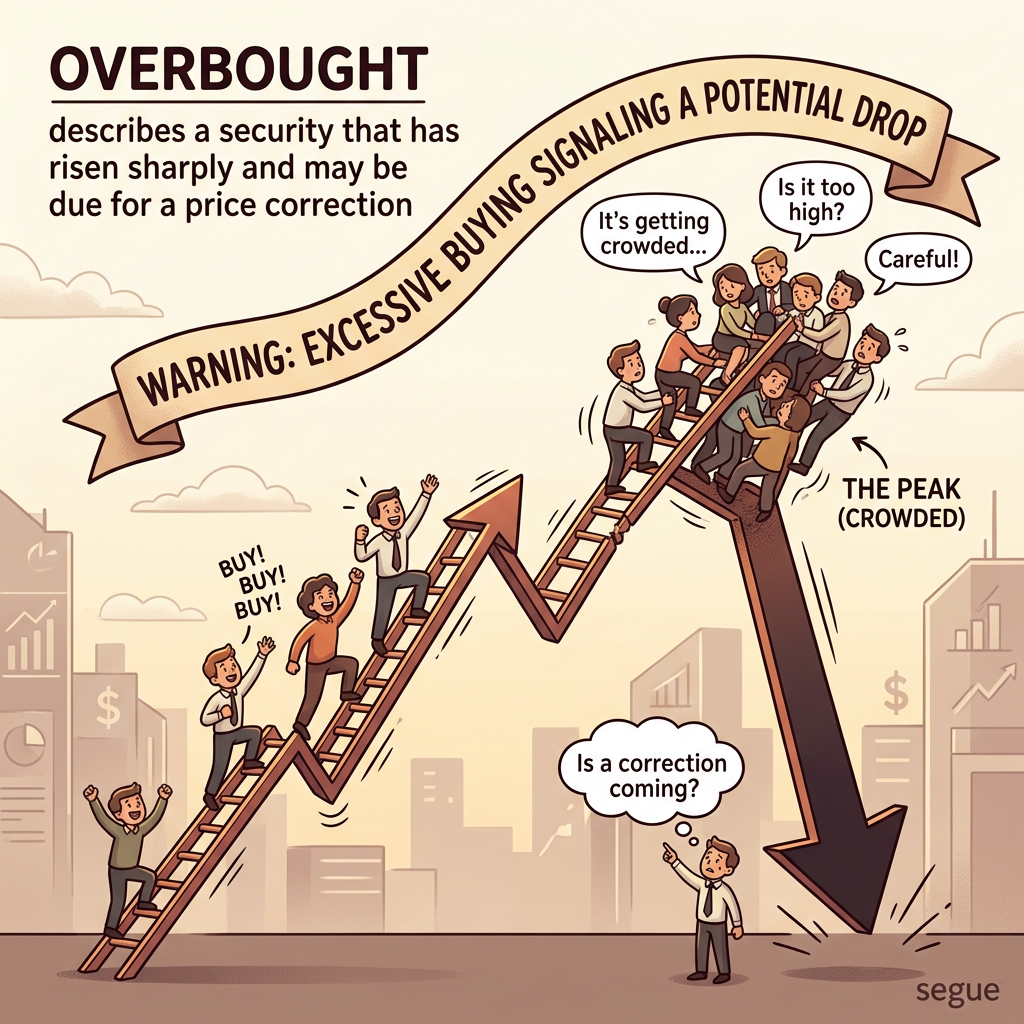
overbought
/ˌoʊvərˈbɔːt/describes a security that has risen sharply and may be due for a price correction
“With an RSI of 85, the stock was deeply overbought after a three-week rally.”

volume
/ˈvɒljuːm/the total number of shares or contracts traded for a security during a given period
“The breakout was confirmed by volume three times the 30-day average.”
More from Economics & Strategy
Explore other vocabulary categories in this collection.