Loading collection...
🧪
Data Science Vocabulary
Data science and analytics terminology
22 words
All 22 Words
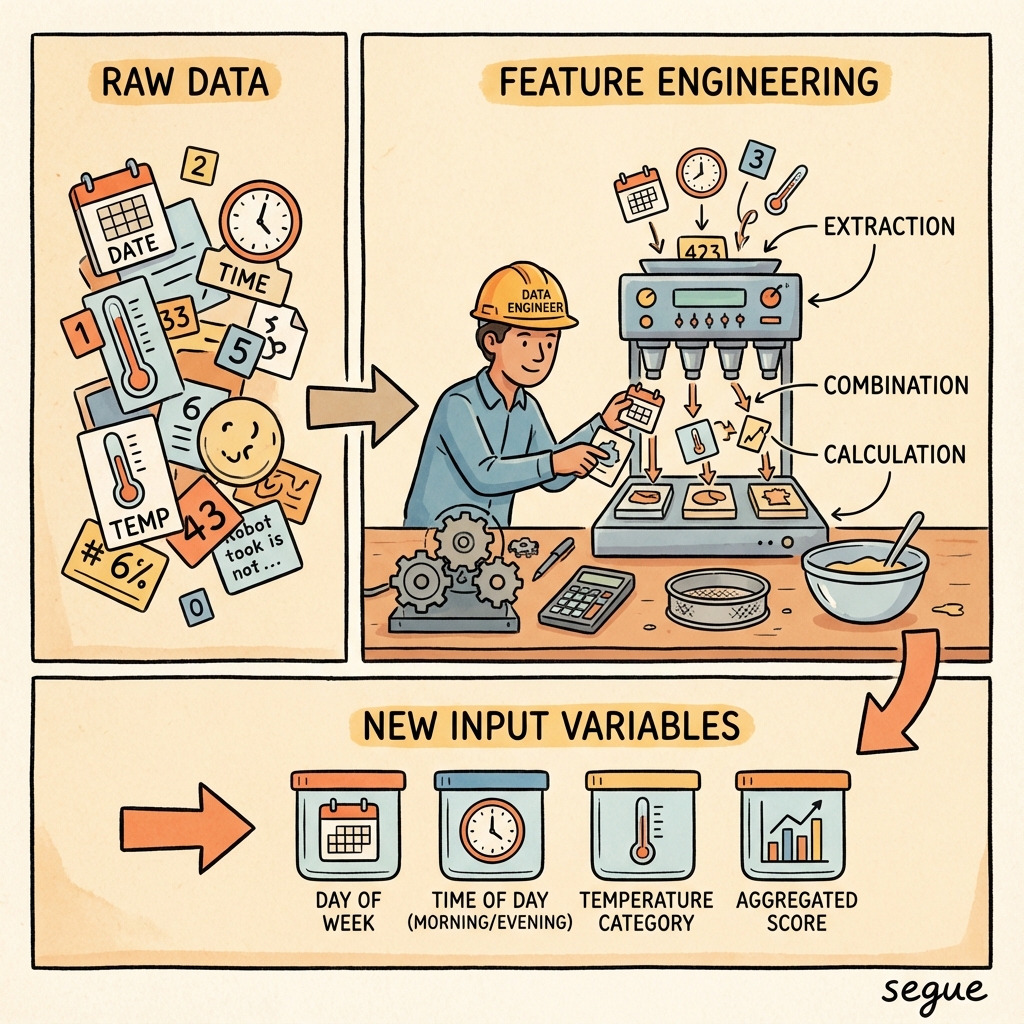
feature engineering
/ˈfiːtʃər ˌendʒɪˈnɪərɪŋ/Creating new input variables from raw data
“Feature engineering extracted meaningful signals from the timestamp data.”
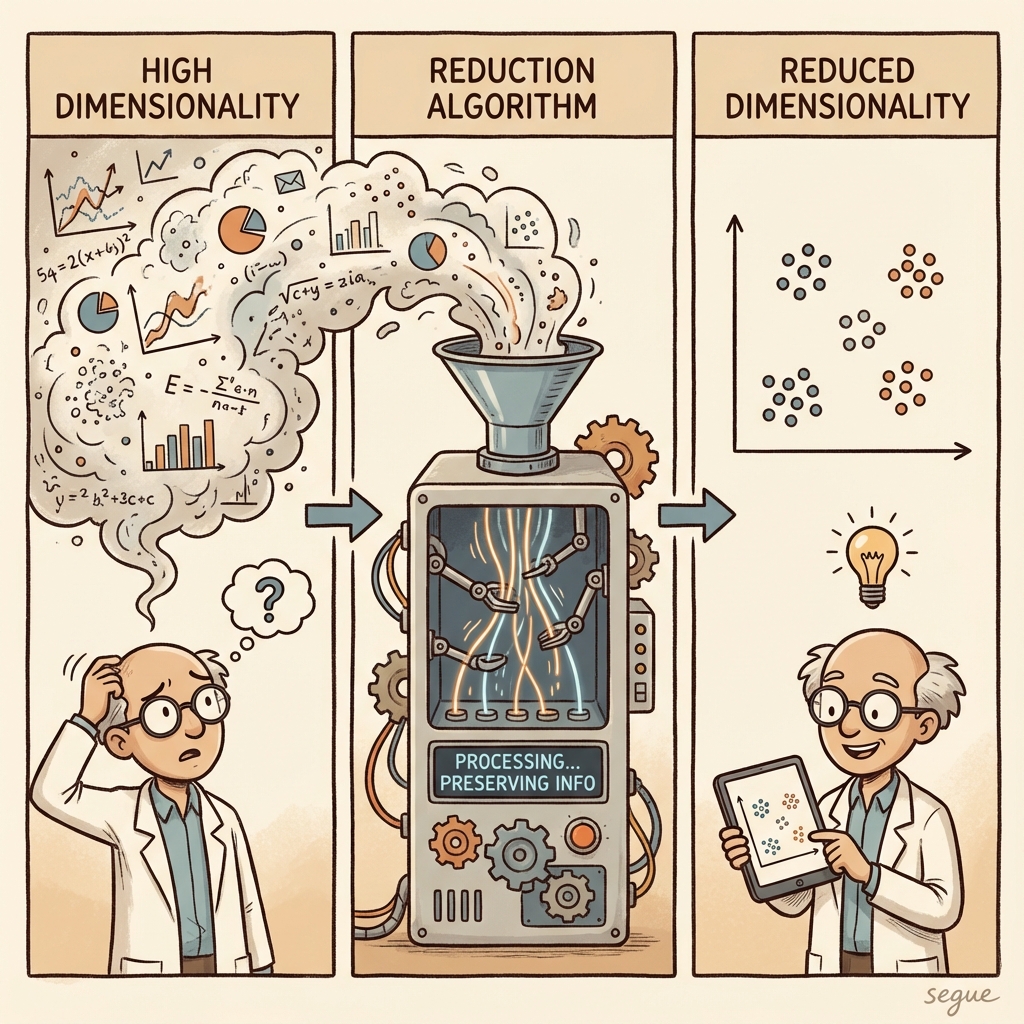
dimensionality reduction
/daɪˌmenʃəˈnælɪti rɪˈdʌkʃən/Reducing the number of variables while preserving information
“Dimensionality reduction made the dataset manageable for visualization.”
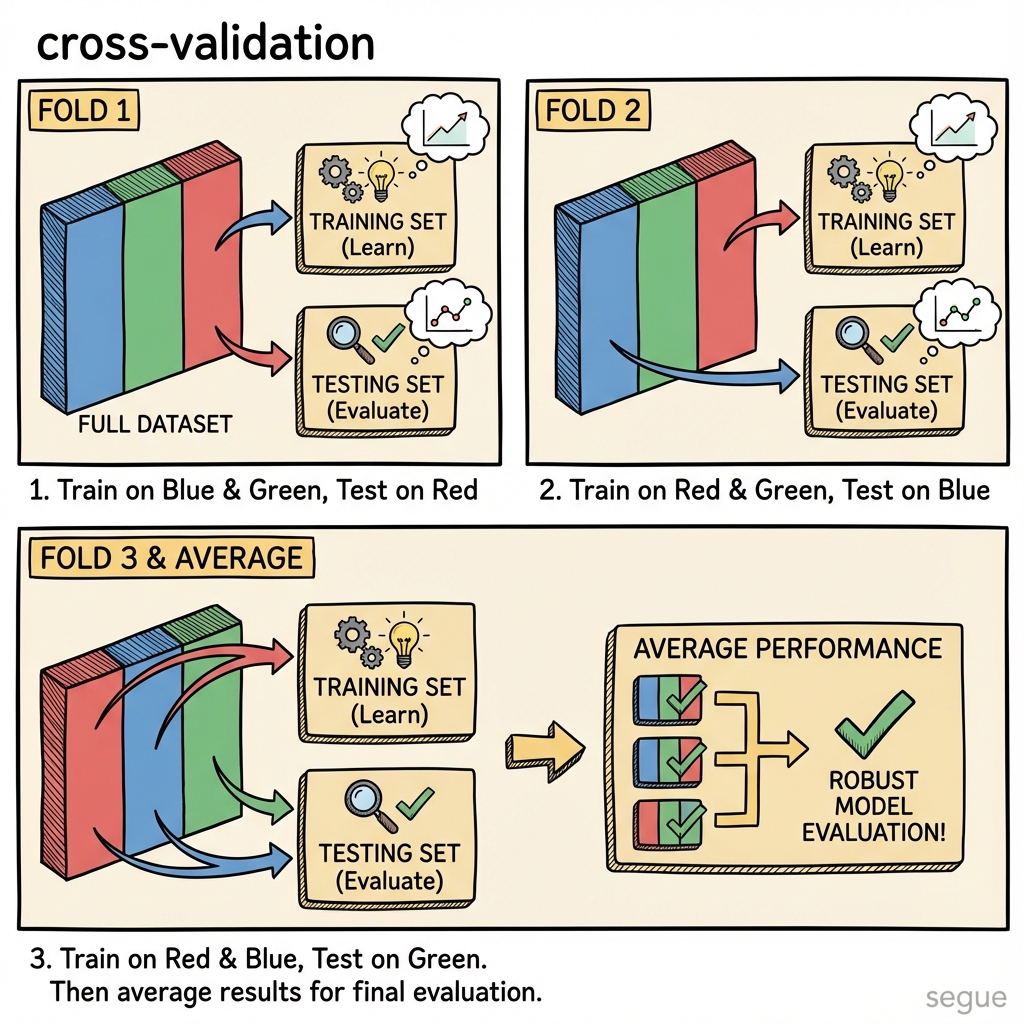
cross-validation
/ˌkrɒs ˌvælɪˈdeɪʃən/Evaluating models by training on subsets and testing on the rest
“Cross-validation revealed the model's true generalization performance.”
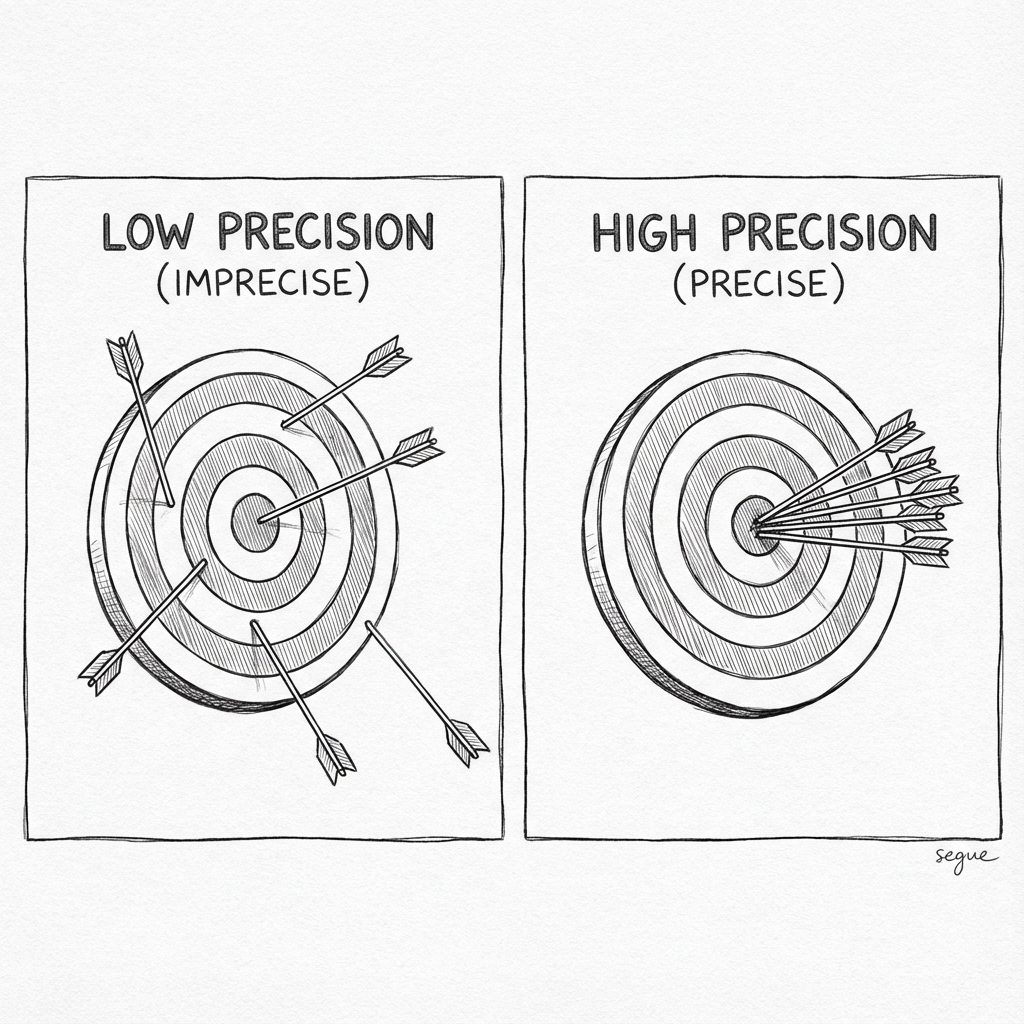
precision
/pɹiˈsɪʒən/The proportion of positive predictions that are correct
“High precision means few false positives in our spam detection.”
recall
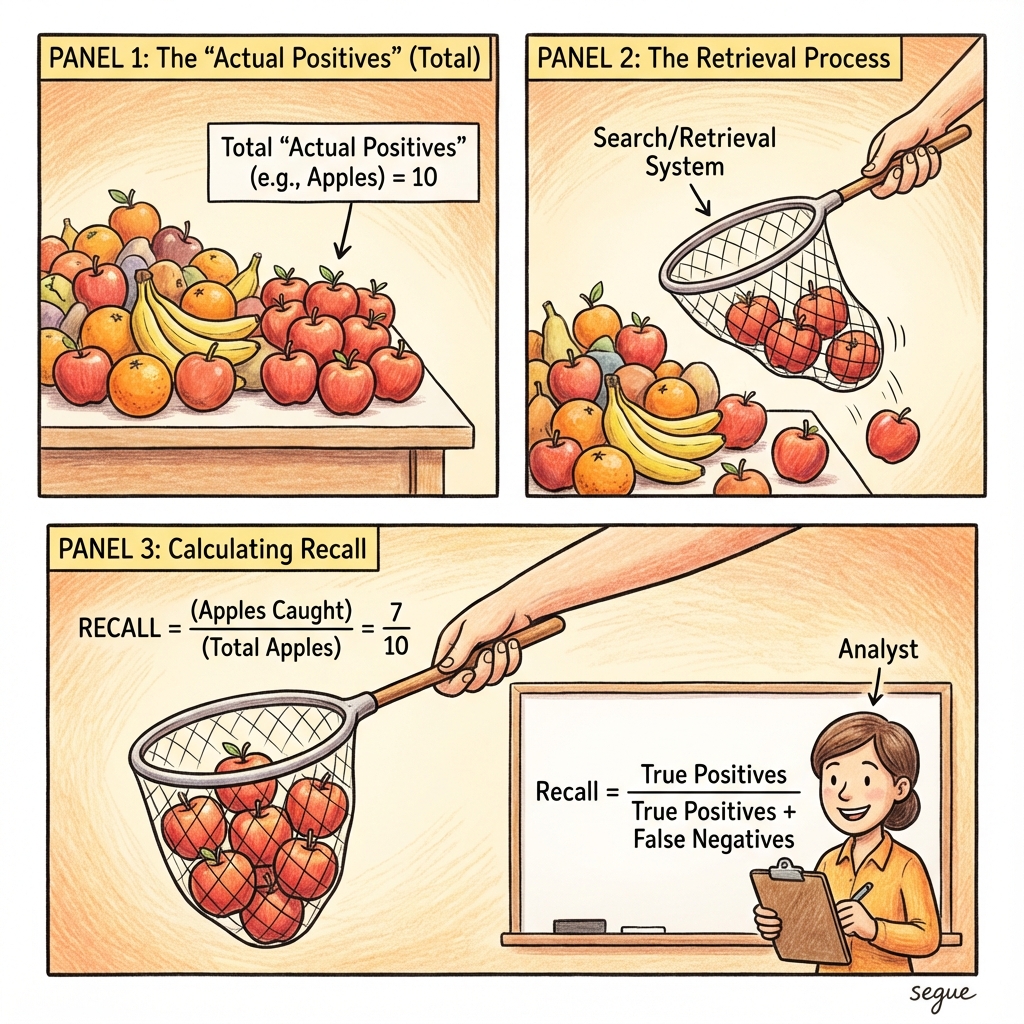
/ˈɹiˌkɔɫ/The proportion of actual positives correctly identified
“High recall ensures we catch most fraudulent transactions.”
F1 score
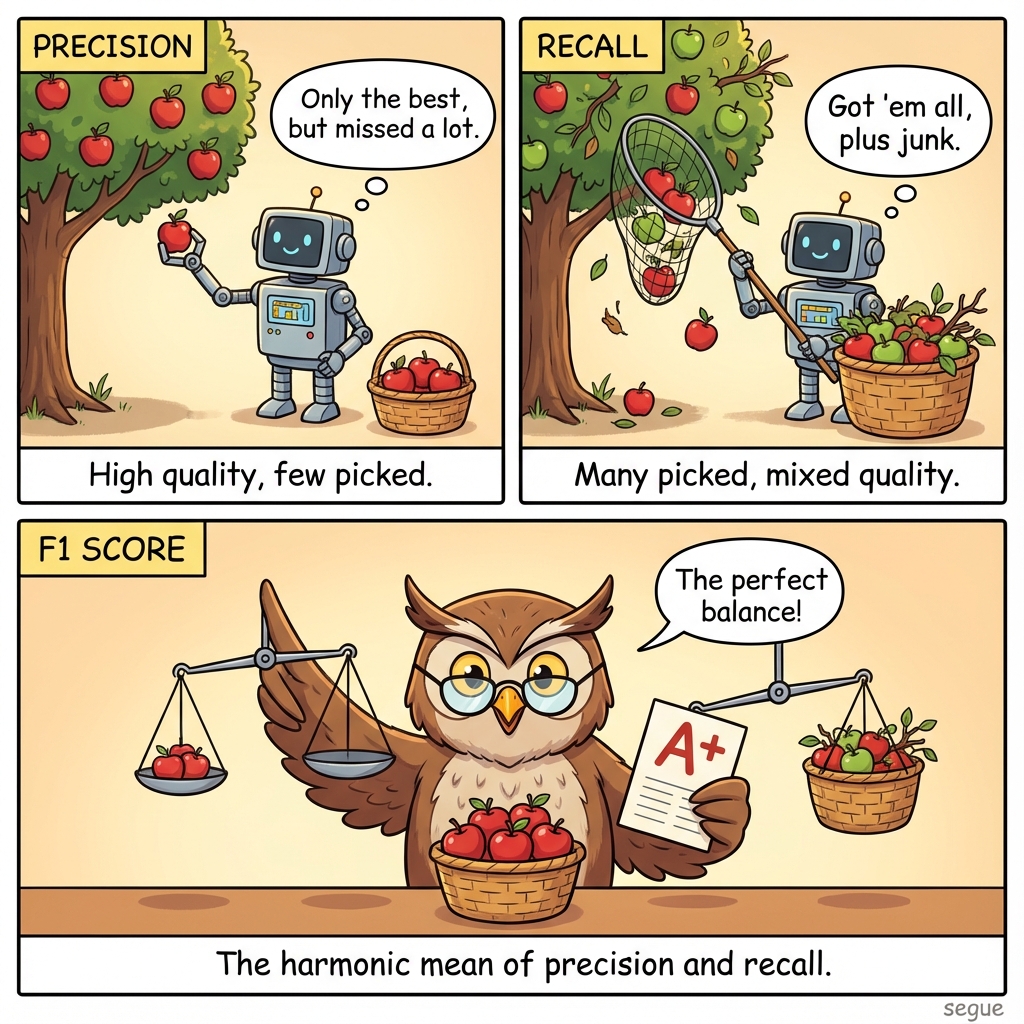
/ˌef ˈwʌn ˌskɔːr/The harmonic mean of precision and recall
“The F1 score balances precision and recall into a single metric.”
ROC curve
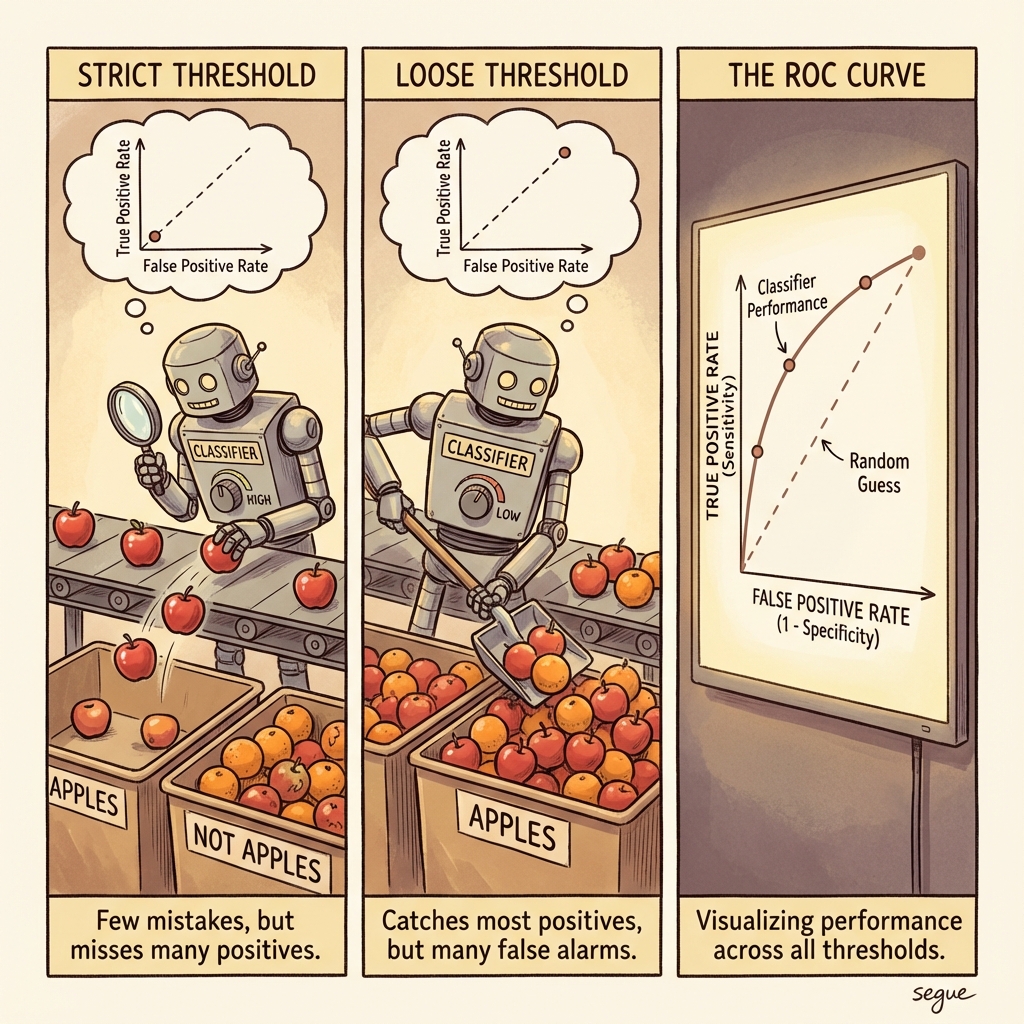
/ˌɑːr oʊ ˈsiː ˌkɜːrv/A graph showing classifier performance at various thresholds
“The ROC curve demonstrated excellent discrimination between classes.”
AUC
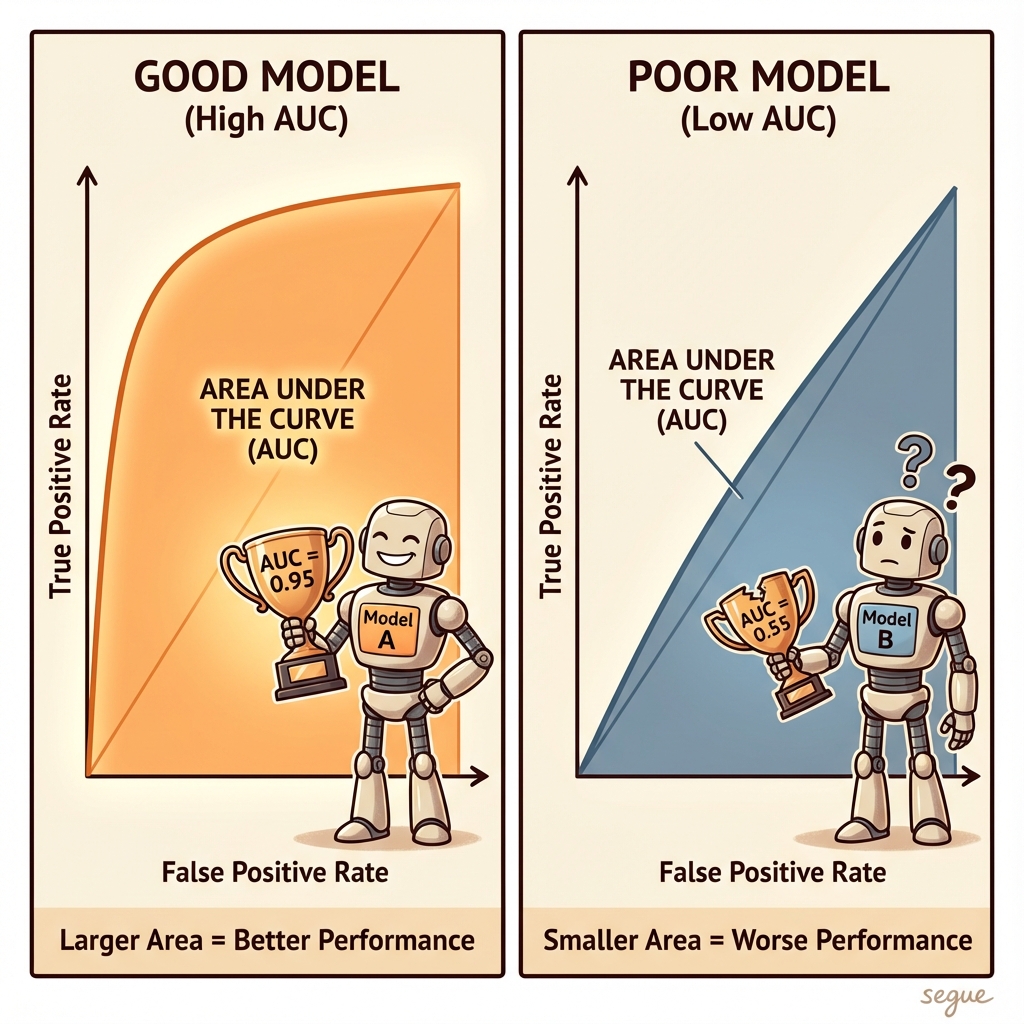
/ˌeɪ juː ˈsiː/Area Under the Curve, measuring overall model performance
“An AUC of 0.95 indicates excellent predictive ability.”
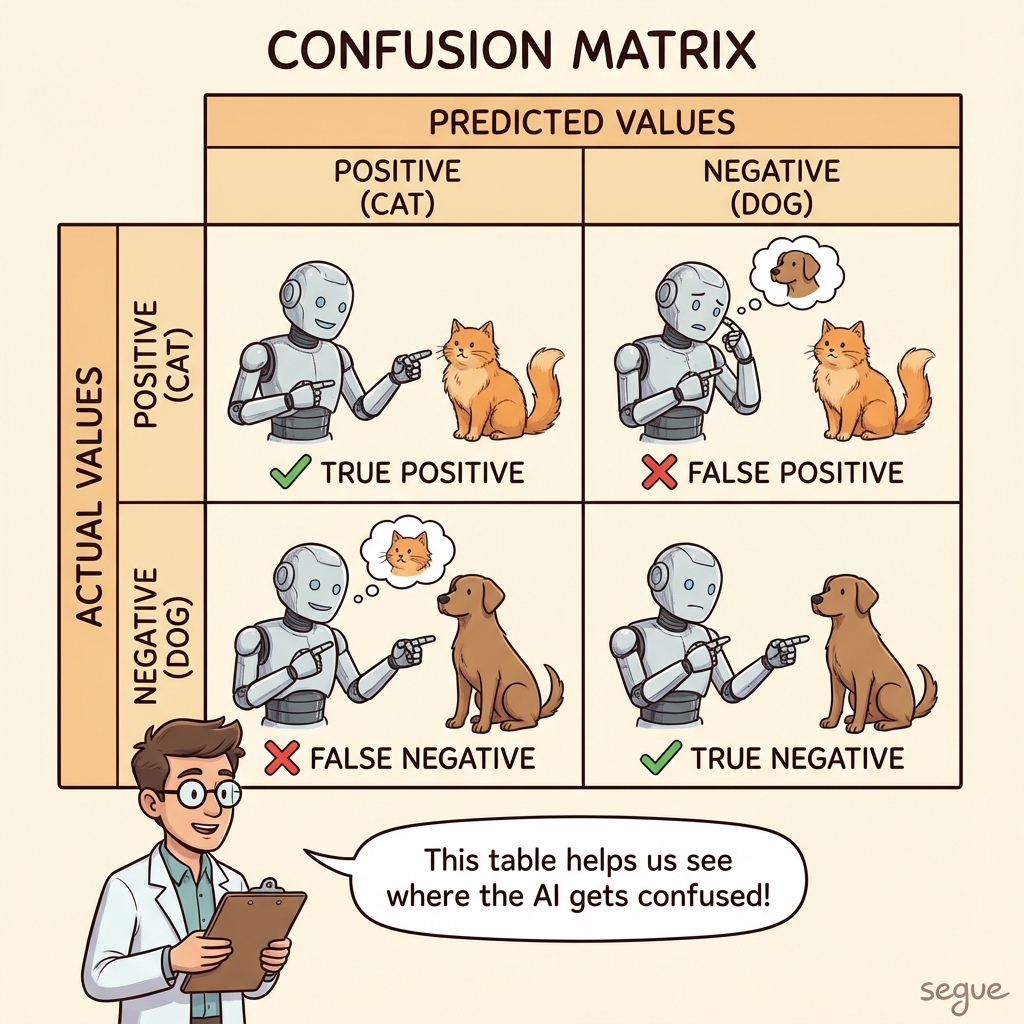
confusion matrix
/kənˈfjuːʒən ˌmeɪtrɪks/A table showing prediction results versus actual values
“The confusion matrix revealed the model confused cats with dogs.”
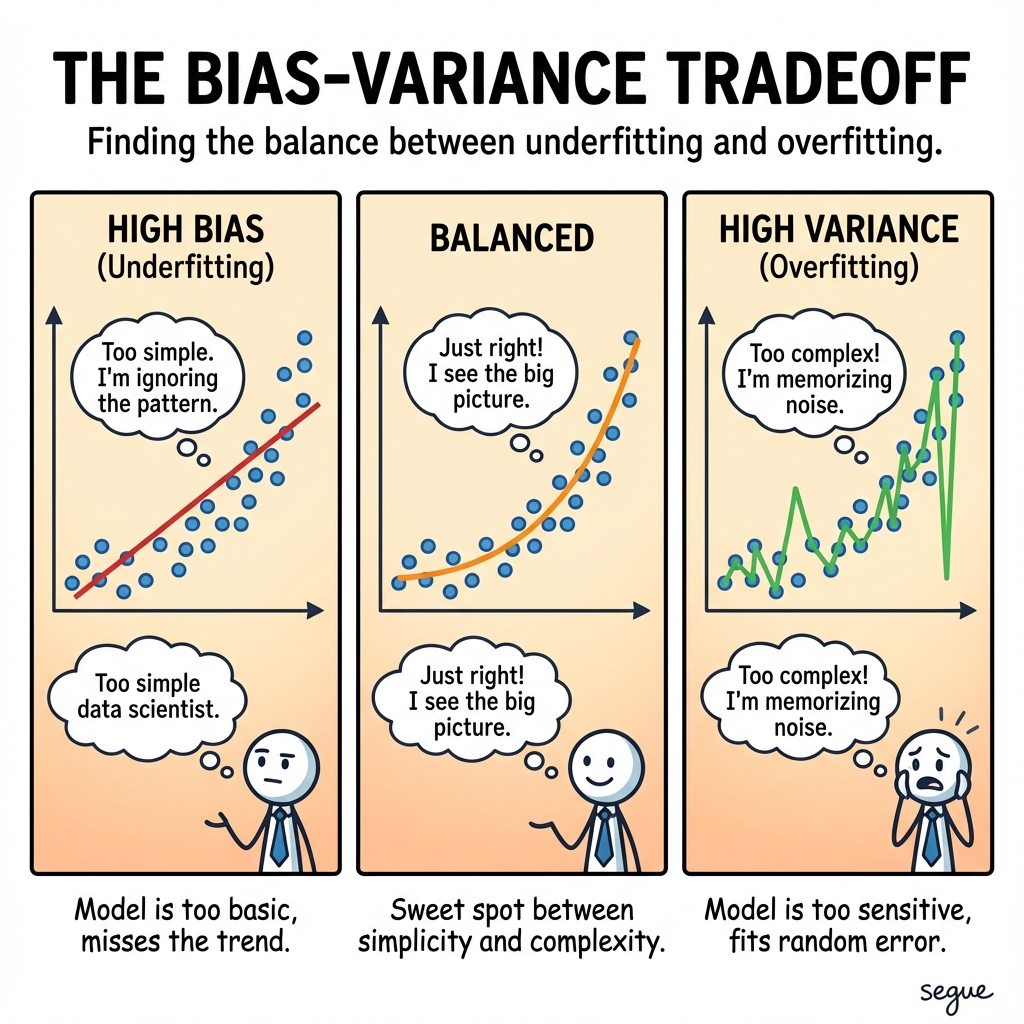
bias-variance tradeoff
/ˌbaɪəs ˈveəriəns ˌtreɪdɒf/The balance between underfitting and overfitting
“Understanding the bias-variance tradeoff guides model complexity decisions.”
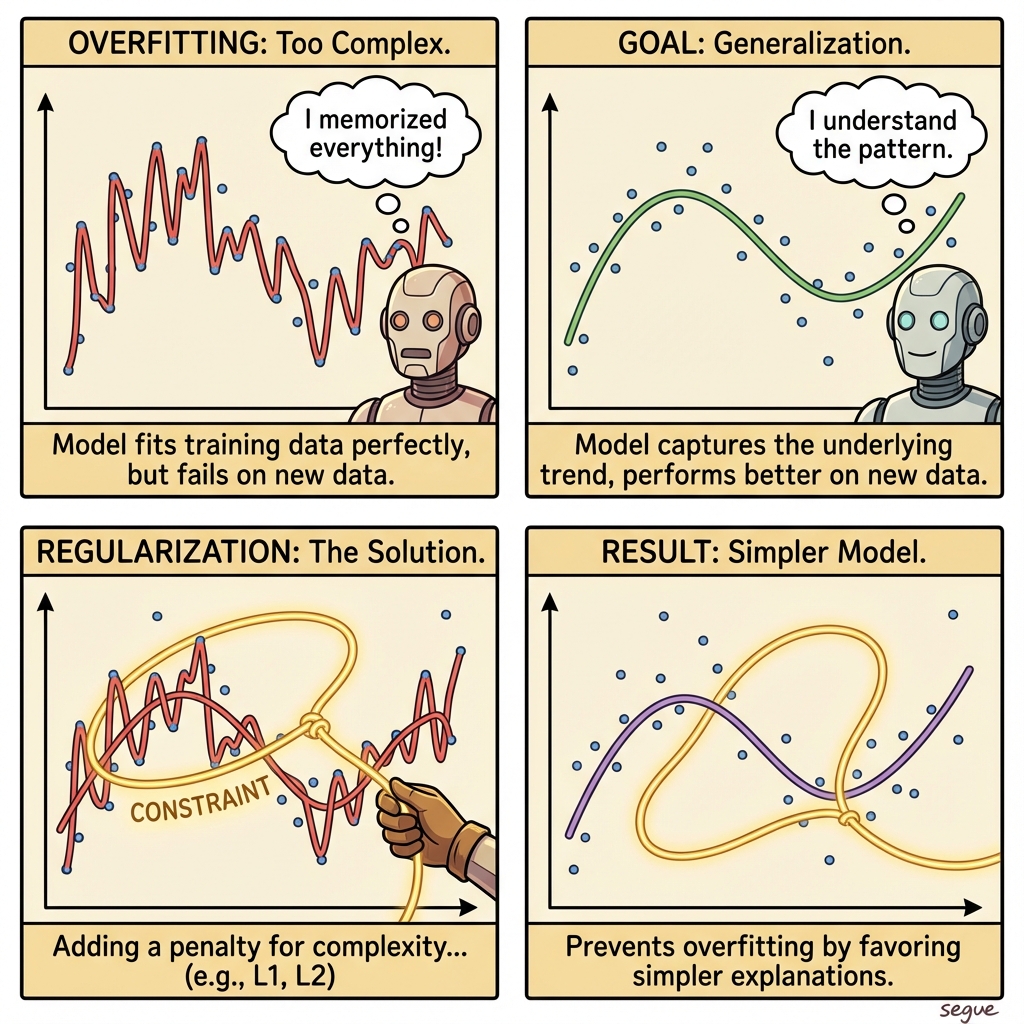
regularization
/ˌreɡjʊləraɪˈzeɪʃən/Techniques to prevent overfitting by penalizing complexity
“Regularization prevented the model from memorizing training data.”
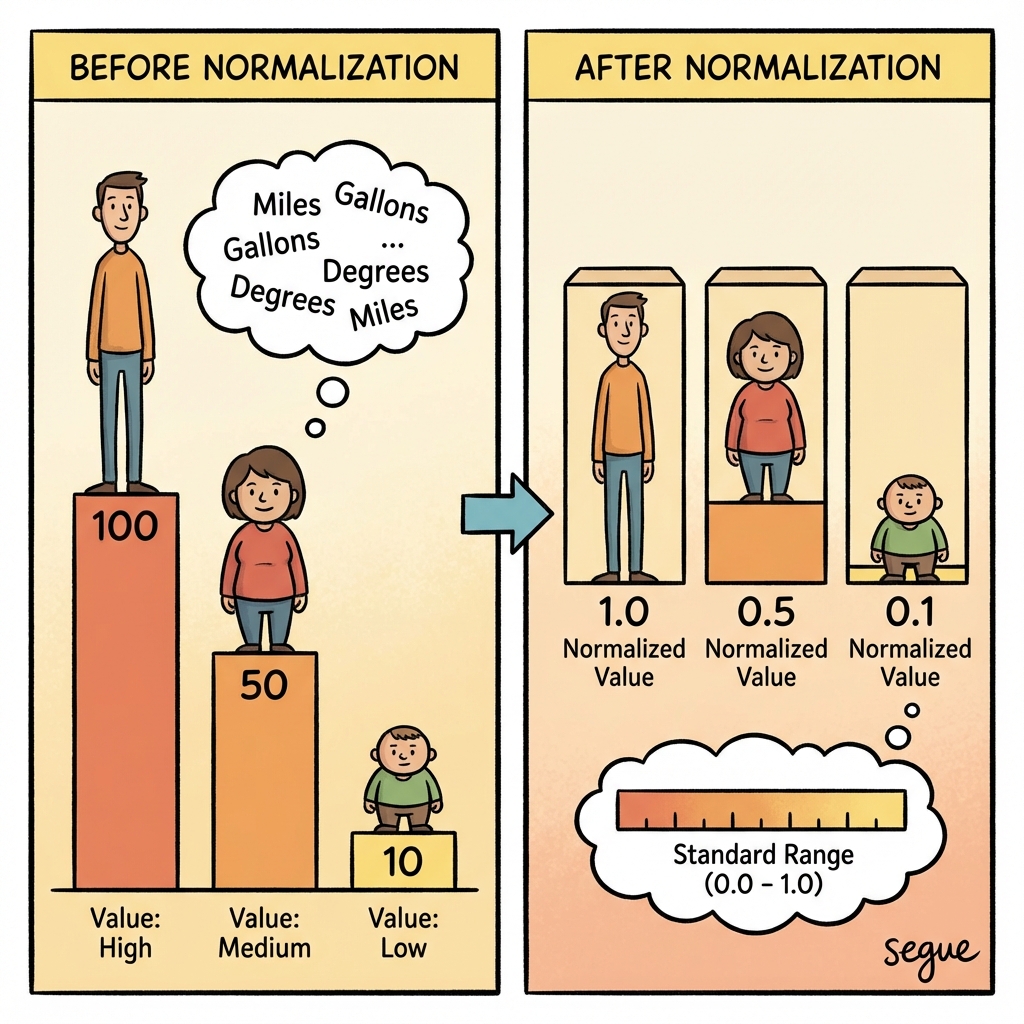
normalization
/ˌnɔɹməɫɪˈzeɪʃən/Scaling data to a standard range
“Normalization ensured all features contributed equally to the model.”
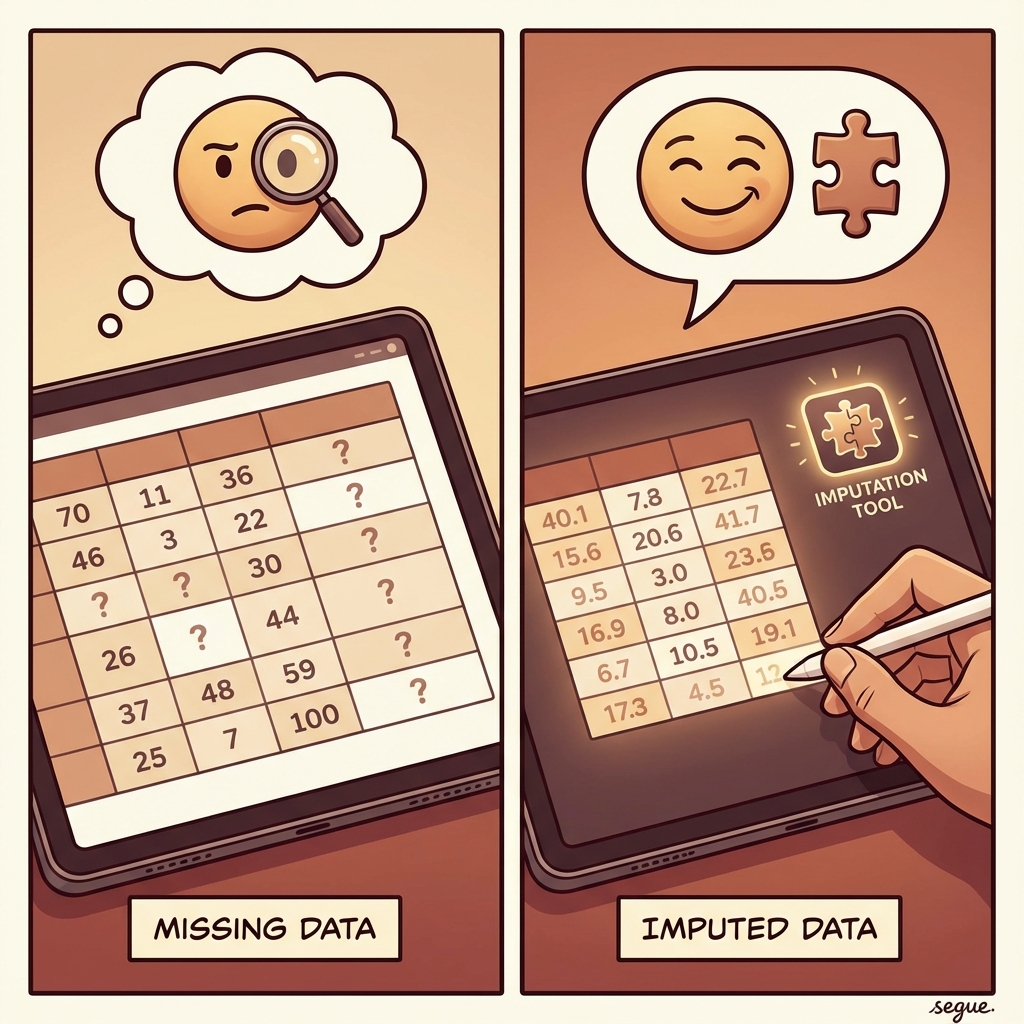
imputation
/ˌɪmpjəˈteɪʃən/Filling in missing data values
“Mean imputation replaced missing values with column averages.”
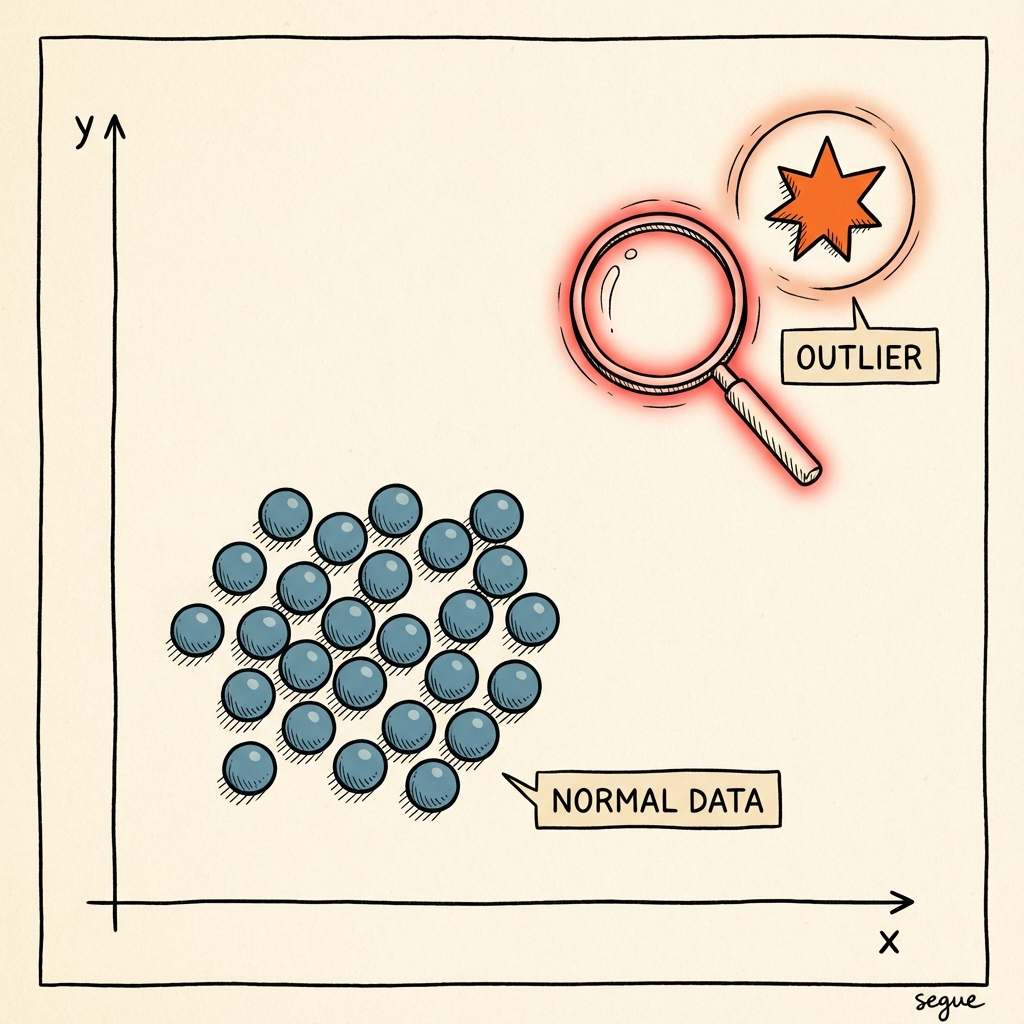
outlier detection
/ˈaʊtlaɪər dɪˌtekʃən/Identifying data points that differ significantly from others
“Outlier detection flagged suspicious transactions for review.”
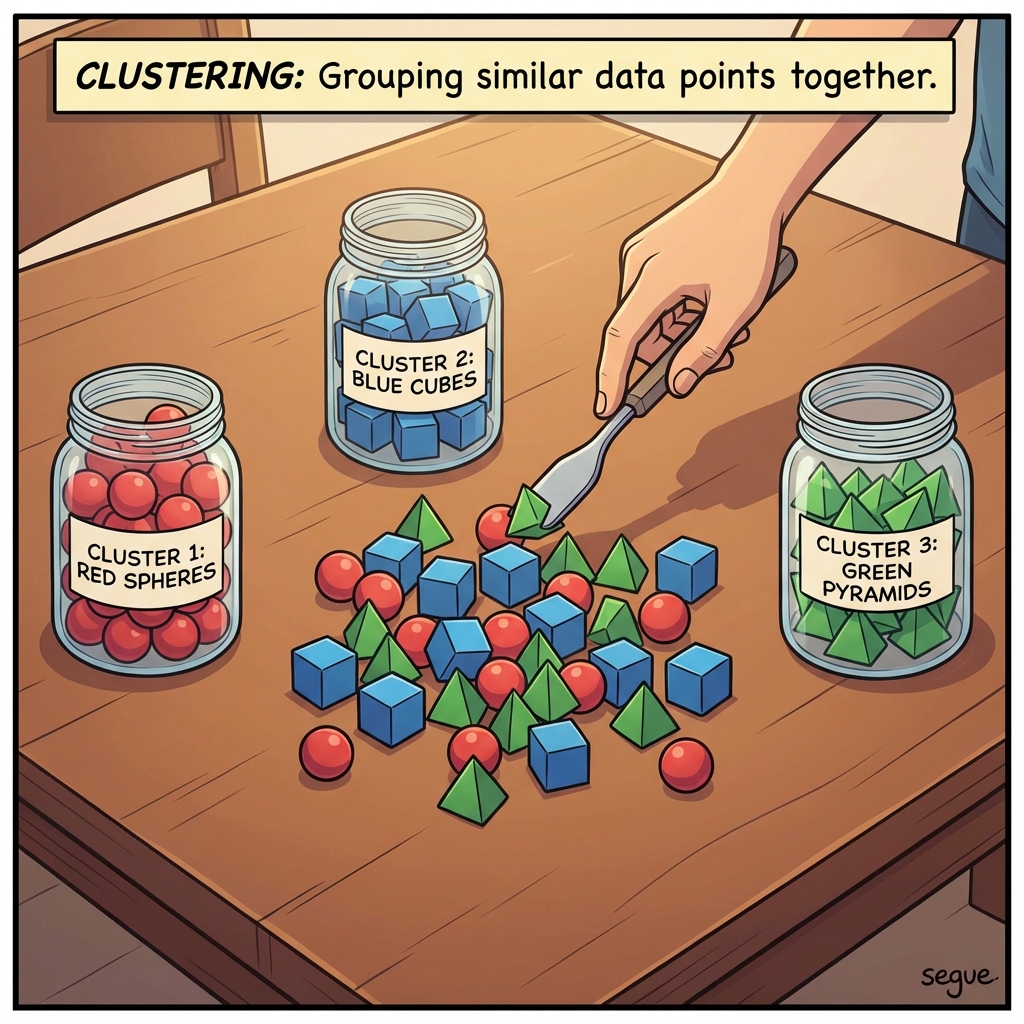
clustering
/ˈkɫəstɝɪŋ/Grouping similar data points together
“Clustering revealed three distinct customer segments.”
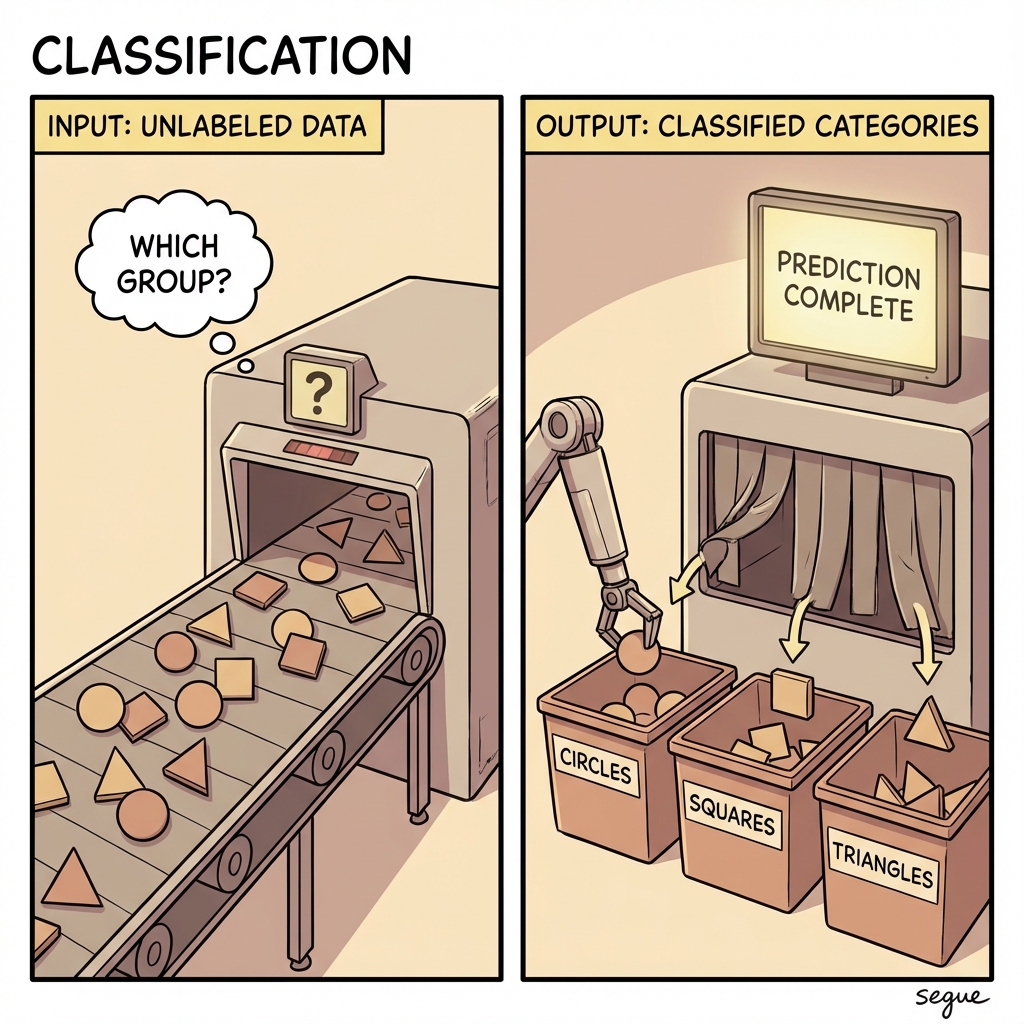
classification
/ˌkɫæsəfəˈkeɪʃən/Predicting which category a data point belongs to
“Classification determines whether an email is spam or legitimate.”
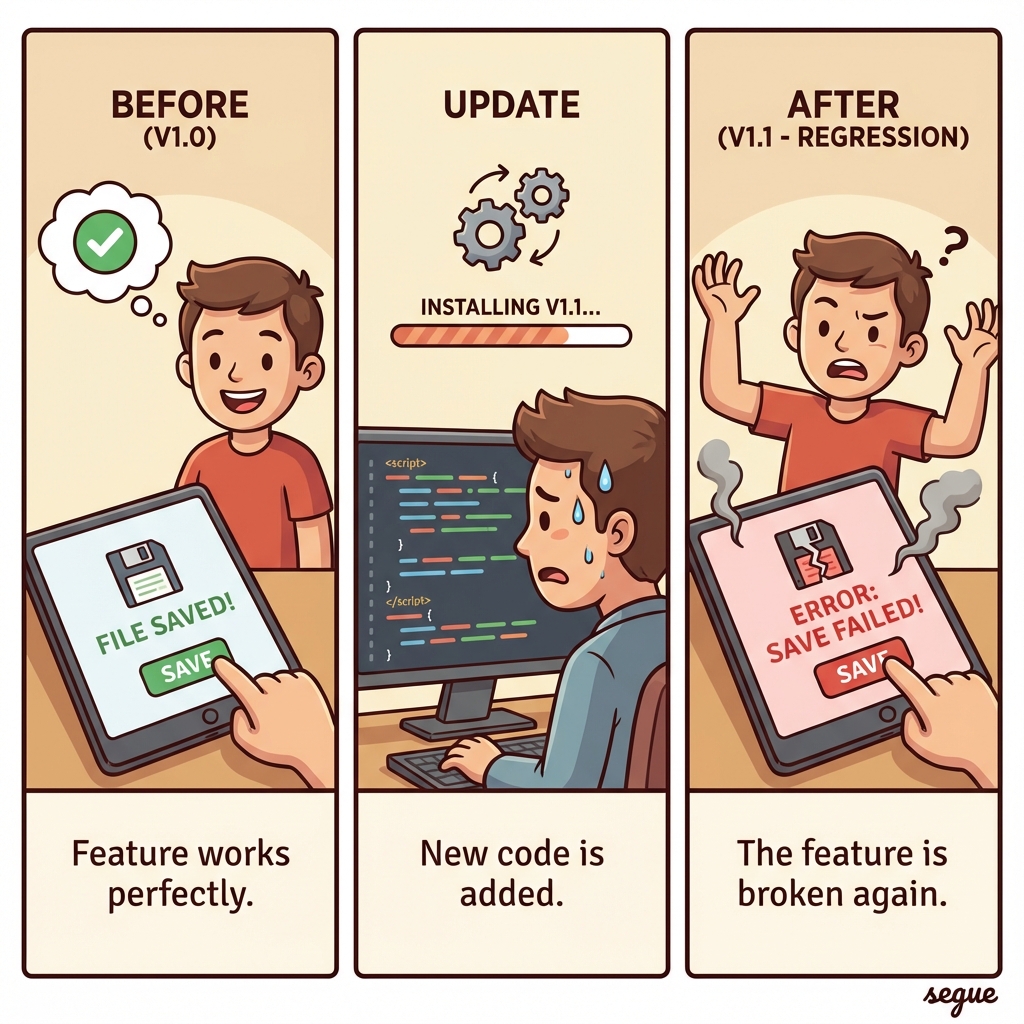
regression
/ɹəˈɡɹɛʃən/Predicting a continuous numerical value
“Regression models forecast next quarter's sales figures.”
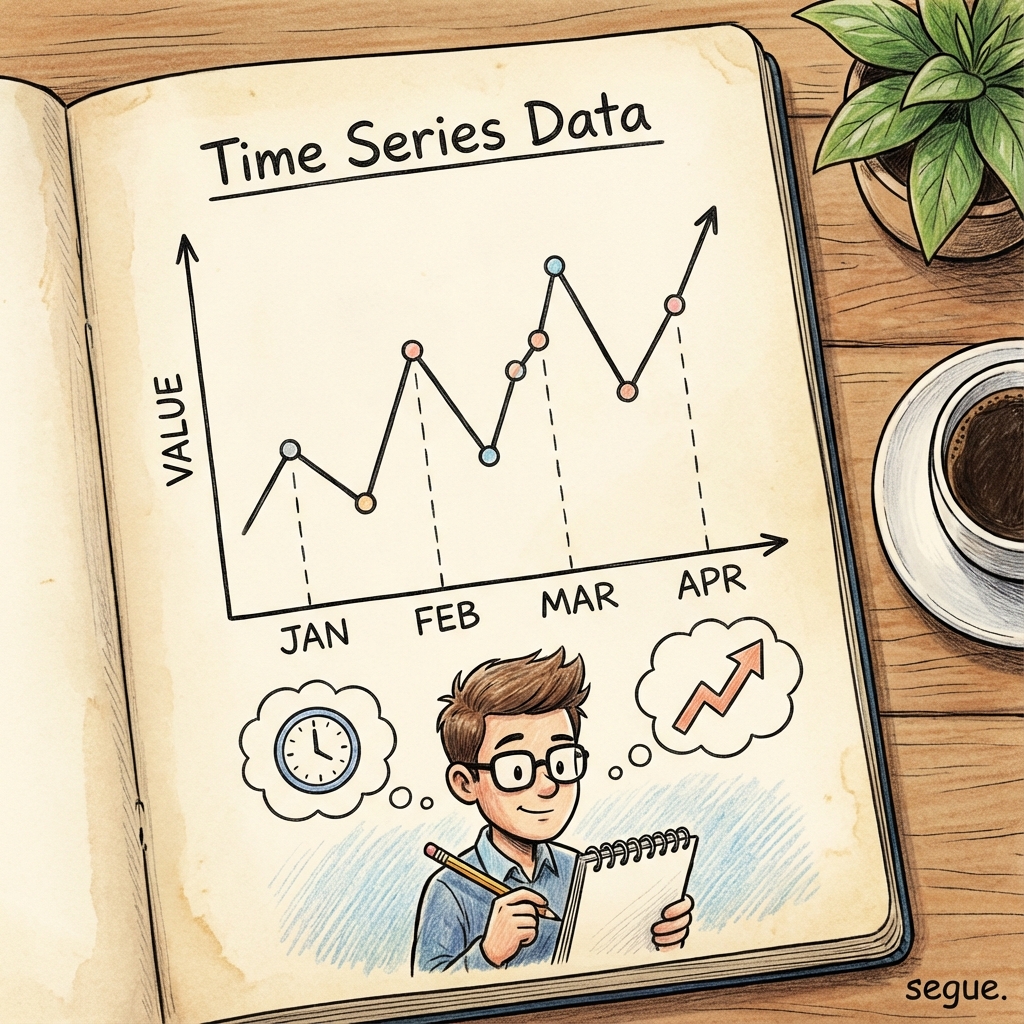
time series
/ˈtaɪm ˌsɪəriːz/Data points indexed in time order
“Time series analysis detected seasonal patterns in demand.”
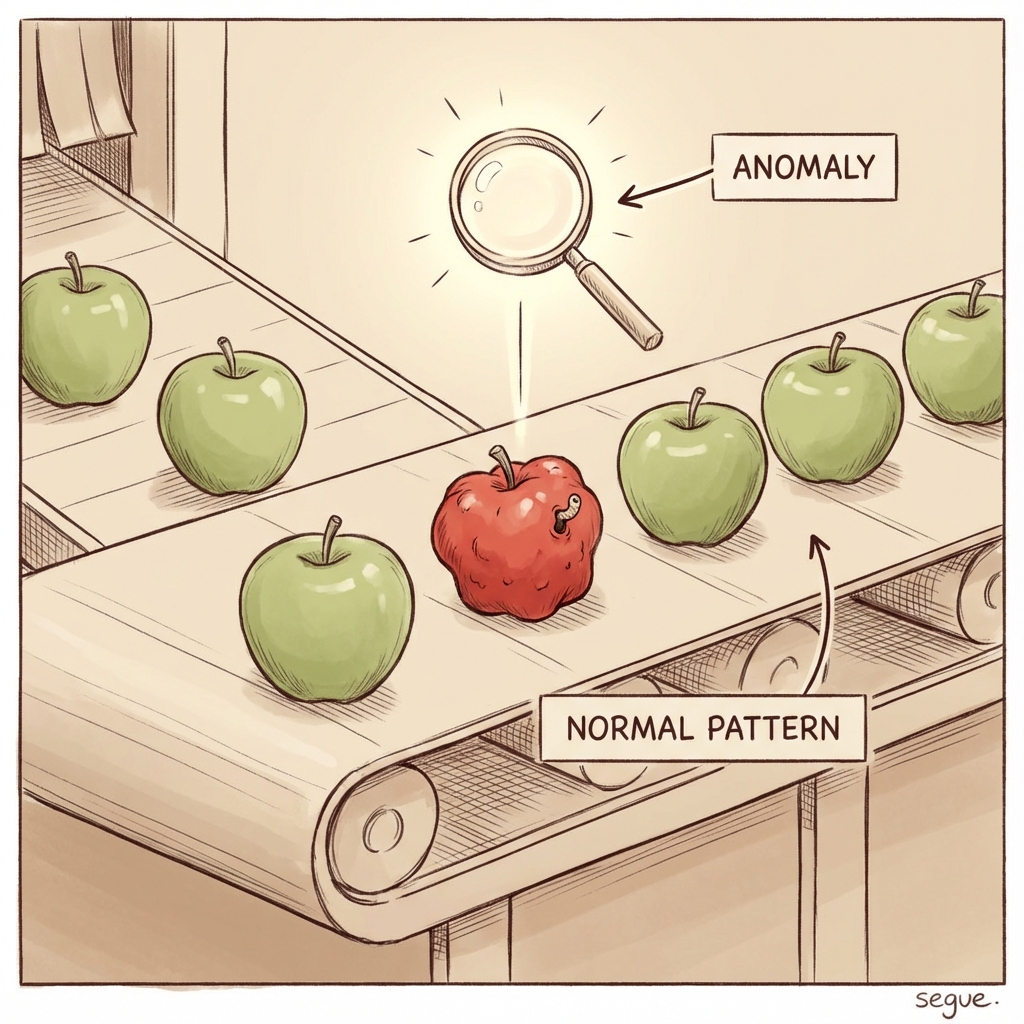
anomaly detection
/əˈnɒməli dɪˌtekʃən/Identifying unusual patterns that don't conform to expected behavior
“Anomaly detection caught the security breach within minutes.”
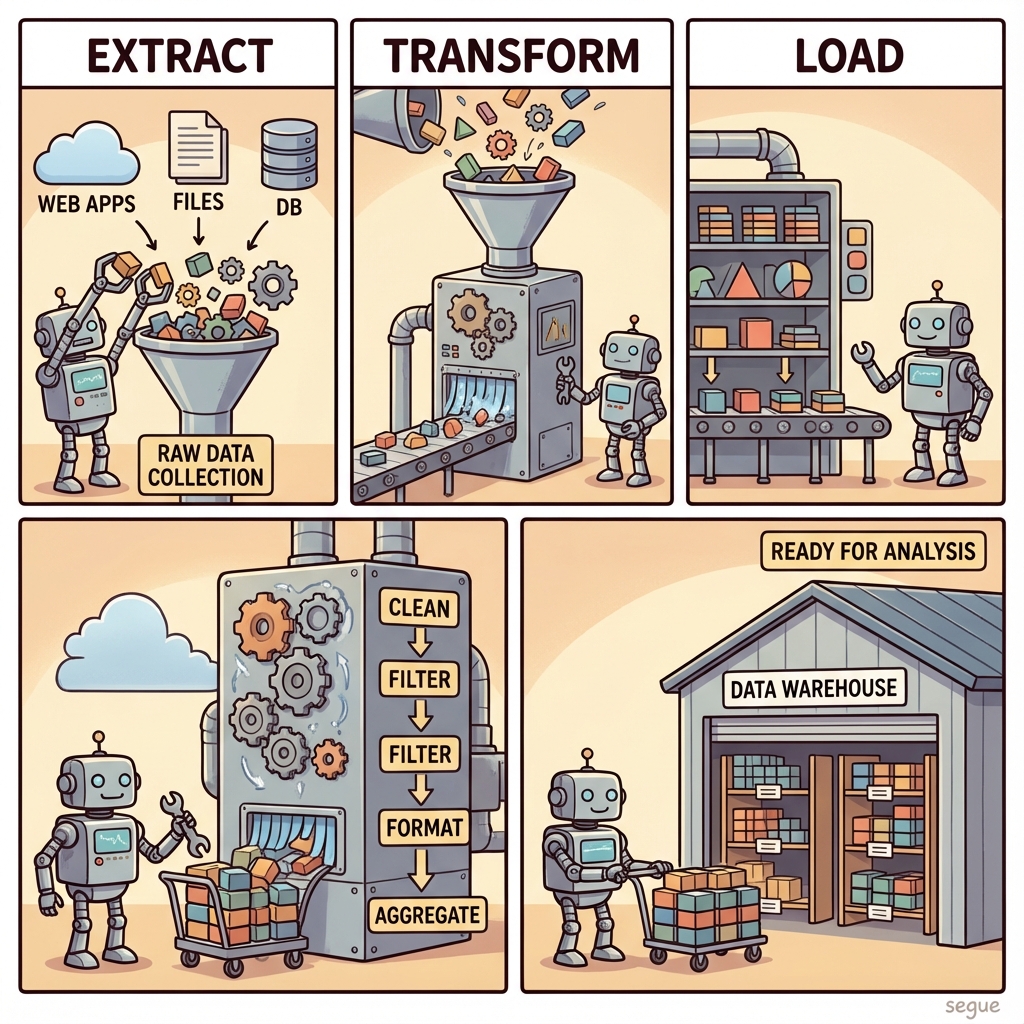
ETL
/ˌiː tiː ˈel/Extract, Transform, Load - the data pipeline process
“The ETL pipeline processes millions of records nightly.”
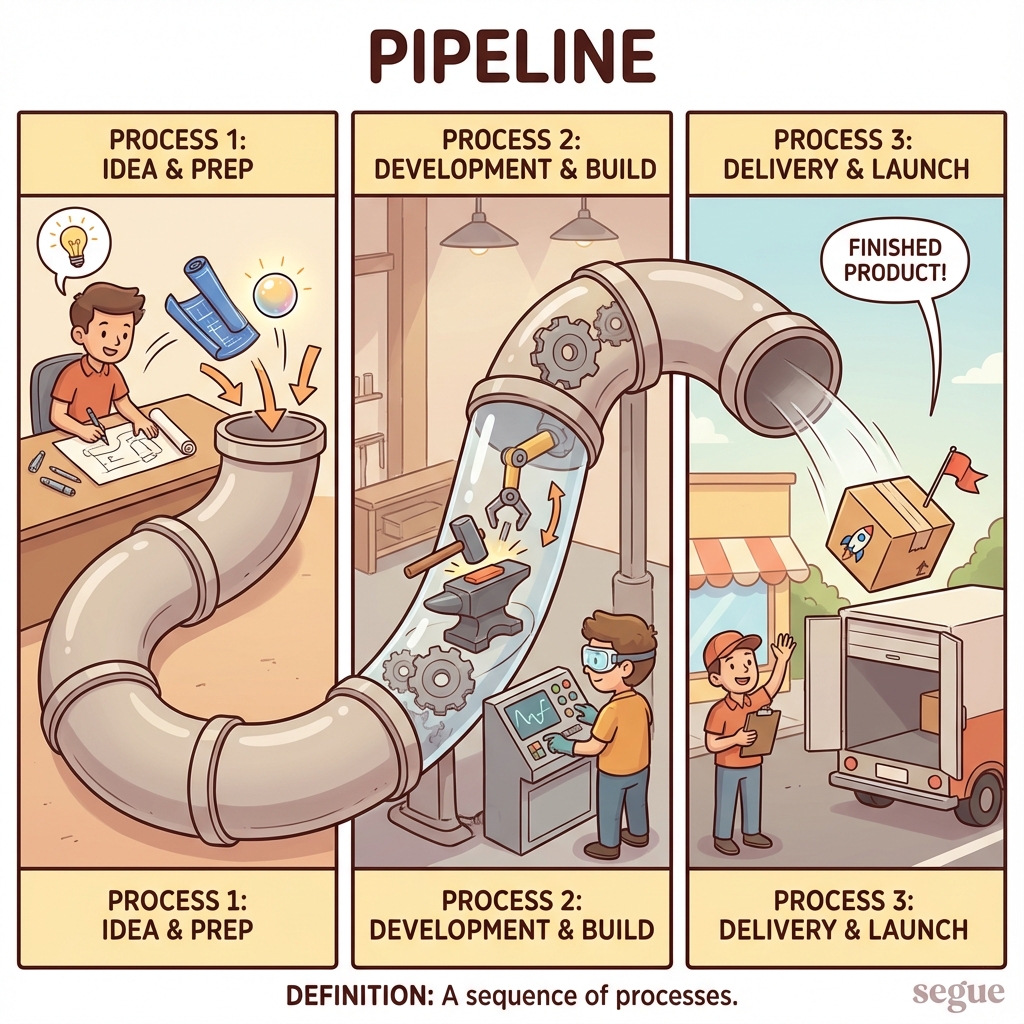
pipeline
/ˈpaɪˌpɫaɪn/A sequence of processes
“The data pipeline cleans and transforms the raw input.”
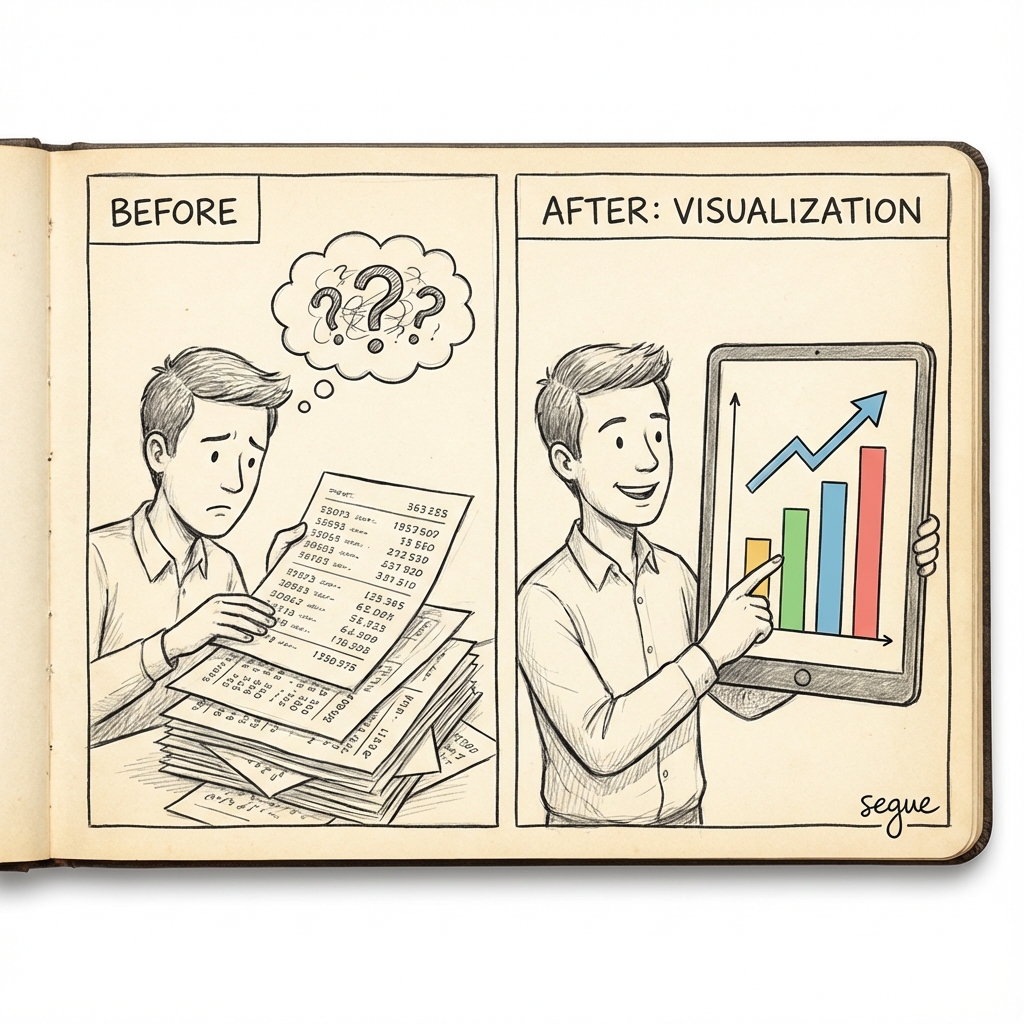
visualization
/ˌvɪʒwəɫəˈzeɪʃən/The representation of an object, situation, or set of information as a chart or other image
“Data visualization helps in identifying trends.”
More from Professional & Legal
Explore other vocabulary categories in this collection.